



This report is brought to you by Skillings Mining Review — the world’s longest-running source of global mining news, covering critical minerals, resource policy, and industry developments since 1912.

Revenue vs. Market Cap: Two Very Different Leaderboards
Ranked by trailing revenue, Glencore sits at the top of the global mining sector by a wide margin. The Switzerland-based commodity trading and mining conglomerate generates more than $255 billion in annual revenue, a figure driven less by mine output alone and more by its enormous physical commodity trading arm, which spans metals, energy, and agricultural products.
Market capitalization tells a different story. By that measure, BHP Group is the most valuable mining company on earth. The Australian giant’s worth is built on iron ore, copper, and coal, and its scale has allowed it to twice cross the $200 billion market cap threshold in recent years — a distinction no other pure-play miner has matched.
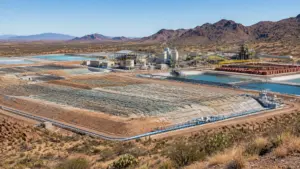
Right behind BHP sits Rio Tinto, the UK-Australian multinational that ranks among the largest miners globally by market value, with a production base anchored in aluminum, iron ore, and copper. Rio Tinto operates across more than 35 countries and continues to expand its copper footprint, including its stake in the Resolution project in Arizona.
More Read

Two other names round out the current top tier. Zijin Mining Group, based in China, has become one of the fastest-expanding players in the sector, with dominant positions in gold, copper, and zinc extraction. And Vale S.A., headquartered in Brazil, remains one of the world’s premier producers of iron ore and nickel, with mining operations extending across six countries.

What the Rankings Don’t Show You
Sitting just outside the absolute top tier are companies like Anglo American, Freeport-McMoRan, Newmont, and China Shenhua Energy, each dominant within a specific commodity niche — platinum group metals, copper and gold, or thermal coal. Further down the list, mid-cap producers such as Teck Resources, Lundin Mining, and Agnico Eagle occupy a tier that professional investors watch closely, since this is often where value opportunities and takeover targets emerge before they reach the headlines.
What Retail Investors Are Actually Talking About
The rankings tell you who’s biggest. They don’t tell you how people actually evaluate these companies before putting money in — and that conversation looks different from the boardroom version.
Across investing communities on Reddit, a few recurring themes show up whenever mining companies come up for discussion:
Balance sheet discipline over story stocks. One frequently echoed piece of advice is to evaluate miners the way value investors evaluate any cyclical business — comparing cost per ounce or pound against peers, checking proven reserves, and favoring management teams with a track record of capital discipline over companies whose valuation rests mainly on exploration potential.
Geography is a risk factor, not a footnote. Several commenters pointed to jurisdiction as one of the first screens they apply, favoring companies with significant operations in politically stable regions and treating exposure to conflict-prone or coup-prone countries as a red flag rather than a diversification benefit.
Mine life and ore grade matter more than headline production numbers. A commonly cited rule of thumb is that a mine life under ten years carries meaningfully higher risk, and that low-grade ore bodies compound that risk further, since thinner margins leave less room for error when commodity prices soften.
Financing structure separates survivors from casualties. Community members with engineering and analyst backgrounds noted that junior and mid-tier miners tend to be shaped heavily by how they raise capital, with early-stage dilution and offtake agreements playing a bigger role in survival than most retail investors initially expect, since debt financing typically requires a bankable feasibility study that many smaller producers never complete.
Relative cost position beats absolute profitability. One insight that came from a former mining engineer reframed the standard profit equation: rather than just looking at sale price minus production cost, the more useful comparison is a company’s production cost relative to its competitors, since the highest-cost producers in any commodity are typically the first to fold when prices turn.
Access rights can kill a project long before geology does. Multiple contributors emphasized that projects with strong reserves have still been abandoned or stalled indefinitely due to an inability to secure right-of-way, utility access, or transport infrastructure — a factor that rarely shows up in headline coverage of a project’s potential.
Related News
- Meeting the Demand for Nickel and Copper: The Role of Recycling and ESG in the Transition to a Greener Future
- Exploring the Explosive Expansion of Africa’s Mining Industry: Trends, Problems, and Opportunities
- NewRange Copper Nickel: The Future of Mining in Minnesota as PolyMet Mine Transforms
- Is Copper becoming the new lithium
- The Fraser Institute Annual Survey of Mining Companies 2021
Vale, a Brazilian multinational mining company, and Anglo American, a British multinational mining company, are also included on the top 100 list. Both companies have a market capitalization of over $70 billion and are significant iron ore producers.
Freeport-McMoRan, an American copper and gold producer, Newmont Mining Corporation, an American gold producer, and AngloGold Ashanti, a South African gold producer, are also on the list.
While these companies have demonstrated remarkable performance and have become major players in the industry, they are not without their challenges. The mining industry faces numerous environmental and social issues, including pollution and human rights violations.
The top 100 Biggest mining companies
| Rank | Company Name | Country | Market Value (USD billion) |
|---|---|---|---|
| 1 | BHP Group | Australia | 231.5 |
| 2 | Rio Tinto | UK/Australia | 156.8 |
| 3 | Vale S.A. | Brazil | 110.2 |
| 4 | Anglo American plc | UK/South Africa | 77.9 |
| 5 | Freeport-McMoRan Inc. | US | 61.4 |
| 6 | Glencore plc | Switzerland/UK | 57.8 |
| 7 | Newmont Corporation | US/Canada | 54.3 |
| 8 | Norilsk Nickel | Russia | 51.5 |
| 9 | Barrick Gold Corporation | Canada | 49.5 |
| 10 | China Shenhua Energy Company Limited | China | 47.7 |
| 11 | Mineral Resources Limited | Australia | 25.7 |
| 12 | Fortescue Metals Group Ltd | Australia | 23.2 |
| 13 | Jiangxi Copper Corporation | China | 22.9 |
| 14 | Southern Copper Corporation | Peru | 21.3 |
| 15 | Newcrest Mining Limited | Australia | 20.9 |
| 16 | Teck Resources Limited | Canada | 18.4 |
| 17 | Zijin Mining Group Co Ltd | China | 17.6 |
| 18 | First Quantum Minerals Ltd | Canada | 16.6 |
| 19 | MMC Norilsk Nickel PJSC | Russia | 15.7 |
| 20 | ArcelorMittal | Luxembourg | 14.9 |
| 21 | Grupo México S.A.B. de C.V. | Mexico | 14.7 |
| 22 | KGHM Polska Miedź SA | Poland | 14.1 |
| 23 | China Molybdenum Co Ltd | China | 13.4 |
| 24 | Sibanye Stillwater Limited | South Africa | 12.9 |
| 25 | Lundin Mining Corporation | Canada | 12.4 |
| 26 | Evraz plc | UK/Russia | 11.6 |
| 27 | Vedanta Resources Limited | India | 10.6 |
| 28 | Turquoise Hill Resources Ltd | Canada | 9.9 |
| 29 | Antofagasta plc | UK/Chile | 9.6 |
| 30 | PT Freeport Indonesia Tbk | Indonesia | 9.5 |
| 31 | Impala Platinum Holdings Limited | South Africa | 8.5 |
| 32 | Yamana Gold Inc. | Canada | 8.1 |
| 33 | Kumba Iron Ore Limited | South Africa | 8.0 |
| 34 | Polyus PJSC | Russia | 7.8 |
| 35 | Jindal Steel and Power Limited | India | 7.7 |
| 36 | AngloGold Ashanti Limited | South Africa | 7.6 |
| 37 | China Coal Energy Company Limited | China | 7.4 |
| 38 | Boliden AB | Sweden | 7.2 |
| 39 | Pan American Silver Corp. | Canada | 6.9 |
| 40 | Wheaton Precious Metals Corp. | Canada | 6.8 |
| 41 | Eramet | France | 6.6 |
| 42 | Mineralogy Pty Ltd | Australia | 6.2 |
| 43 | Mineral and Resources Development Inc. | South Korea | 5.8 |
| 44 | Impala Refining Services Limited | South Africa | 5.6 |
| 45 | Mitsui Mining & Smelting Co Ltd | Japan | 5.2 |
| 46 | PolyMet Mining Corp. | Canada | 4.6 |
| 47 | Oz Minerals Limited | Australia | 4.4 |
| 48 | Fortuna Silver Mines Inc. | Canada | 4.3 |
| 49 | IGO Limited | Australia | 4.2 |
| 50 | FLSmidth & Co. A/S | Denmark | 4.1 |
| 51 | OZ Minerals Limited | Australia | 3.9 |
| 52 | Polymetal International plc | UK/Russia | 3.9 |
| 53 | Anglo American Platinum Limited | South Africa | 3.8 |
| 54 | Hecla Mining Company | US | 3.7 |
| 55 | Petra Diamonds Limited | UK/South Africa | 3.7 |
| 56 | Shandong Gold Mining Co Ltd | China | 3.7 |
| 57 | Jiangxi Ganfeng Lithium Co Ltd | China | 3.6 |
| 58 | Highland Gold Mining Limited | UK/Russia | 3.5 |
| 59 | Gold Fields Limited | South Africa | 3.5 |
| 60 | Kenmare Resources plc | Ireland | 3.5 |
| 61 | KAZ Minerals PLC | UK/Kazakhstan | 3.4 |
| 62 | Kazatomprom | Kazakhstan | 3.4 |
| 63 | Nornickel | Russia | 3.4 |
| 64 | Eramet SA | France | 3.3 |
| 65 | Vedanta Ltd | India | 3.3 |
| 66 | Vedanta Zinc International (VZI) | India | 3.3 |
| 67 | Alrosa | Russia | 3.2 |
| 68 | Northern Star Resources Limited | Australia | 3.2 |
| 69 | PhosAgro | Russia | 3.2 |
| 70 | Mineral Resources Limited (MRL) | Australia | 3.1 |
| 71 | Yara International ASA | Norway | 3.1 |
| 72 | Petra Diamonds | UK/South Africa | 3.1 |
| 73 | Anglo American Platinum | South Africa | 3.0 |
| 74 | Fresnillo plc | UK/Mexico | 3.0 |
| 75 | Turquoise Hill Resources | Canada | 3.0 |
| 76 | African Rainbow Minerals Ltd | South Africa | 2.9 |
| 77 | ArcelorMittal Mines Canada Inc. | Canada | 2.9 |
| 78 | Boliden | Sweden | 2.9 |
| 79 | Buenaventura | Peru | 2.9 |
| 80 | Hudbay Minerals Inc. | Canada | 2.9 |
| 81 | JSC MMC Norilsk Nickel | Russia | 2.9 |
| 82 | National Aluminium Company Ltd. | India | 2.9 |
| 83 | South32 Limited | Australia | 2.9 |
| 84 | Yanzhou Coal Mining Co Ltd | China | 2.9 |
| 85 | Albemarle Corporation | US | 2.8 |
| 86 | Barrick Gold | Canada | 2.8 |
| 87 | BlueScope Steel Limited | Australia | 2.8 |
| 88 | Coeur Mining Inc. | US | 2.8 |
| 89 | Coronado Global Resources Inc. | Australia | 2.8 |
| 90 | Jiangxi Rare Earth & Rare Metals Tungsten Group Co. Ltd. | China | 2.8 |
| 91 | Kazakhmys Corporation | Kazakhstan | 2.8 |
| 92 | KGHM Polska Miedź | Poland | 2.8 |
| 93 | Northam Platinum Limited | South Africa | 2.8 |
| 94 | Polymetal International | UK/Russia | 2.8 |
| 95 | Shanxi Lu’an | China | 2.8 |
| 96 | SSR Mining Inc. | Canada | 2.8 |
| 97 | Stillwater Mining Company | US | 2.8 |
| 98 | Taseko Mines Limited | Canada | 2.8 |
| 99 | AngloGold Ashanti | South Africa | 2.7 |
| 100 | Centamin plc | UK/Australia | 2.7 |
The Takeaway
The biggest mining companies in the world aren’t necessarily the best investments, and the best investments aren’t always the biggest companies. Glencore’s revenue scale, BHP’s market dominance, and Rio Tinto’s diversified footprint make headlines, but the community of people who actually trade these stocks consistently points back to the same fundamentals: balance sheet strength, jurisdiction risk, mine life, ore grade, and financing structure. Rankings are a starting point for understanding the industry’s scale — not a substitute for the due diligence that determines whether any individual mining stock belongs in a portfolio.
For continuing coverage of mining industry rankings, critical minerals policy, and resource sector developments, visit Skillings Mining Review.





Dear
I am from Gilgit Baltistan pakistan, I have gold , copper and antimony mines need an investor , please let me know
My Whattsap no # 923455444733